Introduction
Efficient and accurate data migration is crucial for organizations undergoing system upgrades, mergers, or moving to new data platforms. This project showcases a framework that automates data migration, detects and corrects data inconsistencies, and ensures high data integrity using machine learning techniques.
Project Architecture
The framework consists of the following components:
- Data Simulation
- Data Extraction
- Data Transformation
- Anomaly Detection and Correction
- Data Loading
Folder Structure
.
├── app.py
├── generate_plots.py
├── requirements.txt
├── logs.log
├── data
│   ├── source_data.csv
│   └── target_data.csv
├── static
│   ├── images
│   │   ├── amount_distribution.png
│   │   └── anomalies_detected.png
│   └── styles.css
├── templates
│   └── documentation.html
├── etl
    ├── data_simulation.py
    ├── extract.py
    ├── transform.py
    ├── anomaly_detection.py
    ├── load.py
    ├── run_pipeline.py
ETL Pipeline
The ETL pipeline orchestrates the entire process from data simulation to data loading, ensuring that the data is clean and ready for use in downstream applications.
Data Simulation
The pipeline begins by simulating financial transaction data, including the introduction of anomalies to test the anomaly detection capabilities.
# etl/data_simulation.py
import pandas as pd
import numpy as np

def simulate_data(num_records=10000):
    """
    Simulates financial transaction data with anomalies.

    Args:
        num_records (int): Number of records to generate.

    Returns:
        pd.DataFrame: Simulated data.
    """
    np.random.seed(42)
    data = pd.DataFrame({
        'transaction_id': range(1, num_records + 1),
        'amount': np.random.normal(loc=1000, scale=200, size=num_records),
        'currency': np.random.choice(['USD', 'EUR', 'GBP'], size=num_records),
        'timestamp': pd.date_range(start='2023-01-01', periods=num_records, freq='T'),
        'account_number': np.random.randint(100000, 999999, size=num_records),
        'transaction_type': np.random.choice(['debit', 'credit'], size=num_records)
    })
    # Introduce anomalies
    anomalies = data.sample(frac=0.05, random_state=42)
    data.loc[anomalies.index, 'amount'] *= 10  # Inflate amount
    return data

if __name__ == '__main__':
    simulated_data = simulate_data()
    simulated_data.to_csv('data/source_data.csv', index=False)
Data Extraction
The extraction step reads data from the source CSV file.
# etl/extract.py
import pandas as pd

def extract_data(filepath):
    """
    Extracts data from the source file.

    Args:
        filepath (str): Path to the source data file.

    Returns:
        pd.DataFrame: Extracted data.
    """
    data = pd.read_csv(filepath)
    return data

if __name__ == '__main__':
    data = extract_data('data/source_data.csv')
Data Transformation
The transformation step performs data cleaning and normalization to prepare the data for anomaly detection.
# etl/transform.py
import pandas as pd

def transform_data(data):
    """
    Transforms the extracted data.

    Args:
        data (pd.DataFrame): Extracted data.

    Returns:
        pd.DataFrame: Transformed data.
    """
    # Handle missing values
    data = data.dropna()
    # Normalize amount
    data['amount_normalized'] = (data['amount'] - data['amount'].mean()) / data['amount'].std()
    # Encode categorical variables
    data = pd.get_dummies(data, columns=['currency', 'transaction_type'])
    return data

if __name__ == '__main__':
    data = pd.read_csv('data/source_data.csv')
    transformed_data = transform_data(data)
    transformed_data.to_csv('data/processed_data.csv', index=False)
Anomaly Detection and Correction
PyCaret's anomaly detection module is used to identify and correct anomalies in the data.
# etl/anomaly_detection.py
from pycaret.anomaly import setup, create_model, assign_model
import pandas as pd

def detect_and_remove_anomalies(data):
    """
    Detects and removes anomalies from the data.

    Args:
        data (pd.DataFrame): Transformed data.

    Returns:
        pd.DataFrame: Cleaned data.
    """
    s = setup(data, silent=True, session_id=123)
    model = create_model('iforest', fraction=0.05)
    results = assign_model(model)
    clean_data = results[results['Anomaly'] == 0].reset_index(drop=True)
    return clean_data

if __name__ == '__main__':
    data = pd.read_csv('data/processed_data.csv')
    clean_data = detect_and_remove_anomalies(data)
    clean_data.to_csv('data/target_data.csv', index=False)
Data Loading
The cleaned data is then loaded into the target CSV file.
# etl/load.py
import pandas as pd

def load_data(data, filepath):
    """
    Loads data into the target file.

    Args:
        data (pd.DataFrame): Cleaned data.
        filepath (str): Path to the target data file.
    """
    data.to_csv(filepath, index=False)

if __name__ == '__main__':
    clean_data = pd.read_csv('data/target_data.csv')
    load_data(clean_data, 'data/target_data.csv')
Libraries Used
The following libraries are utilized in this project:
- Pandas - Data manipulation and analysis
- NumPy - Numerical computing
- PyCaret - Machine learning automation library
- Matplotlib - Data visualization
- Seaborn - Statistical data visualization
- Flask - Web framework for hosting the documentation
- scikit-learn - Machine learning algorithms
- Jinja2 - Templating engine for HTML pages
- Highlight.js - Syntax highlighting
Ensure all dependencies are installed by running:
pip install -r requirements.txt
Results
Data Statistics
The following table shows the data statistics after cleaning:
| transaction_id | account_number | amount | transaction_type_debit | |
|---|---|---|---|---|
| count | 9500.000000 | 9500.000000 | 9500.000000 | 9500.000000 |
| mean | 4978.520947 | 537107.900526 | 1011.919437 | 0.506842 |
| std | 2875.336410 | 249905.160373 | 387.492646 | 0.499979 |
| min | 1.000000 | 100126.000000 | 187.079380 | 0.000000 |
| 25% | 2486.750000 | 321894.750000 | 864.081450 | 0.000000 |
| 50% | 4976.500000 | 537962.500000 | 1000.369000 | 1.000000 |
| 75% | 7457.250000 | 755385.000000 | 1135.121900 | 1.000000 |
| max | 10000.000000 | 970678.000000 | 12514.170000 | 1.000000 |
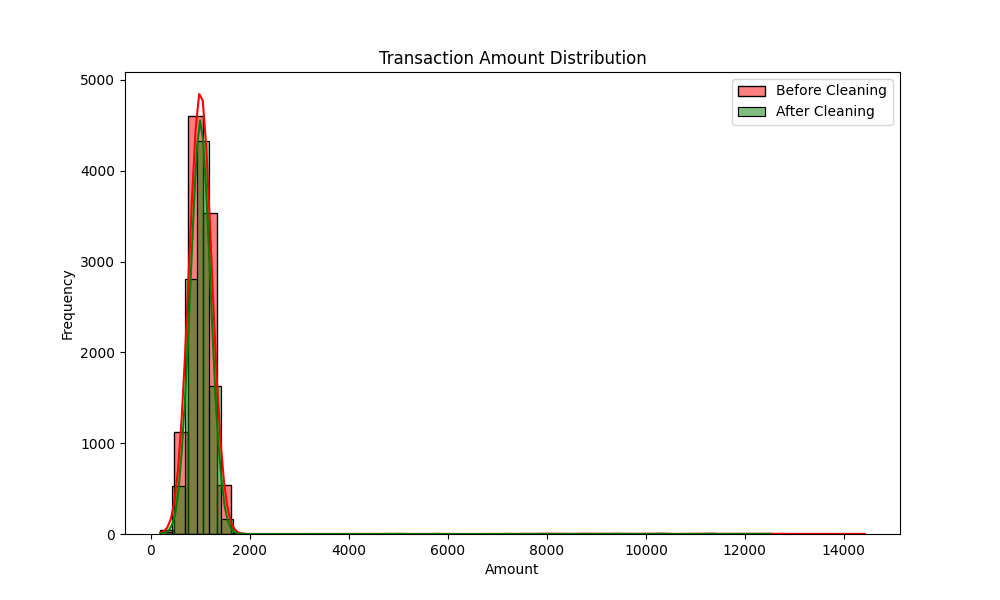
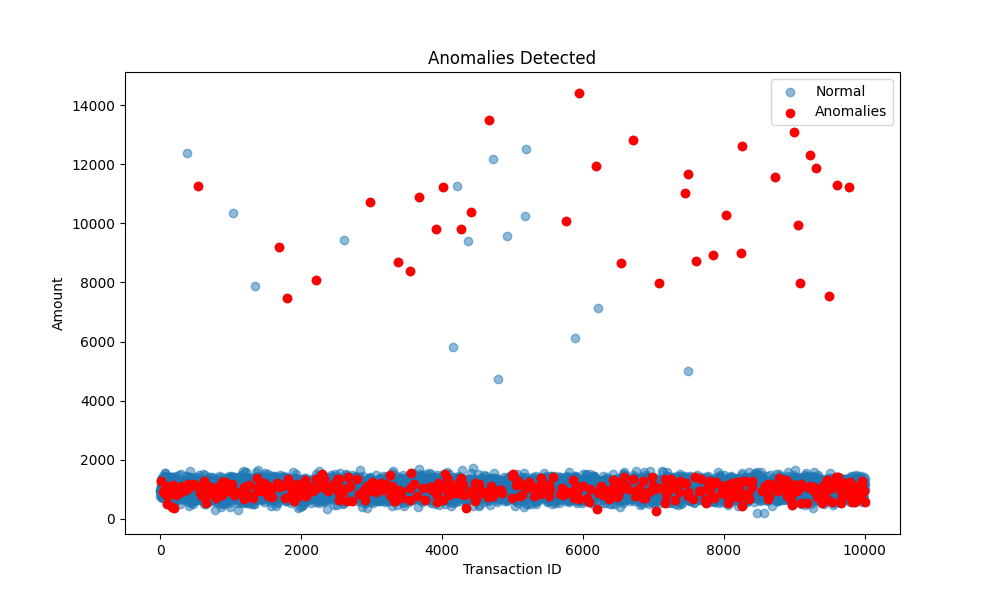
Graphs
Here are some graphs illustrating the efficiency of the anomaly detection:
Transaction Amount Distribution Before and After Cleaning
Anomalies Detected
Conclusion
This project demonstrates the effective use of machine learning in automating data migration processes and enhancing data quality. By combining ETL practices with anomaly detection, it ensures that organizations can trust the data they rely on for critical decisions.
Contact Information
If you have any questions or would like to discuss this project further, please feel free to reach out:
Email: [email protected]
LinkedIn: Shaily Sharma